
Description
*Strategy signals are emailed daily, prices are USD charged monthly.
Strategy Overview: Relative Volatility Arbitrage
This strategy employs a quantitative approach to volatility trading by exploiting the structural inefficiencies between equity index derivatives and the underlying spot volatility. By systematically analyzing the spread between implied volatility (IV) and realized volatility (RV), the strategy captures alpha through the mean-reversion of volatility risk premiums.
Core Methodology
The strategy monitors the “volatility surface” of major indices, comparing the pricing of options and futures against the actual movement of the underlying market.
-
The Signal: When implied volatility is significantly overextended relative to historical norms or current index movement, the strategy takes a tactical position.
-
The Edge: Utilizing UVXY (1.5x leveraged short-term), VXX (short-term), and VXZ (mid-term), the model identifies mispricing along the VIX futures term structure. This allows for precise positioning whether the curve is in contango (favoring short volatility) or backwardation (favoring long volatility).
Strategic Advantages
-
Dynamic Flexibility: Unlike “short-vol” only funds, this strategy trades both Long and Short. This ensures participation in “volatility spikes” while harvesting premium during quiet markets.
-
Risk-Adjusted Performance: By rotating between short-term and mid-term instruments (VXX vs. VXZ), the strategy optimizes the “roll yield” while minimizing the decay typically associated with leveraged products.
-
Performance Profile: Historically characterized by a High Rate of Return (ROR%) and low maximum drawdowns, achieved through a strict regime-detection filter that reduces exposure during unpredictable “black swan” transitions.
Key Instruments Traded
| Instrument | Focus | Role in Strategy |
| UVXY | 1.5x Short-Term VIX | High-alpha tactical long/short trades. |
| VXX | Short-Term VIX | Primary vehicle for capturing daily volatility shifts. |
| VXZ | Mid-Term VIX | Hedging and stabilizing the portfolio during high-gamma regimes. |
Note: This strategy is designed for investors seeking non-correlated returns that can perform in both bull and bear market environments by focusing purely on the “fear gauge” of the market.
Key metrics
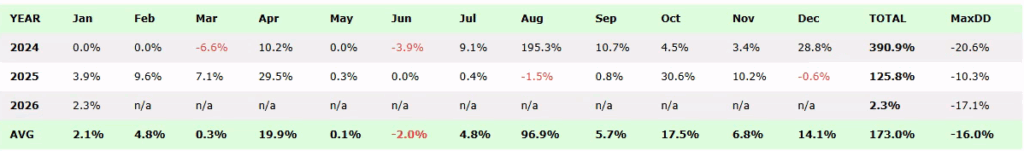
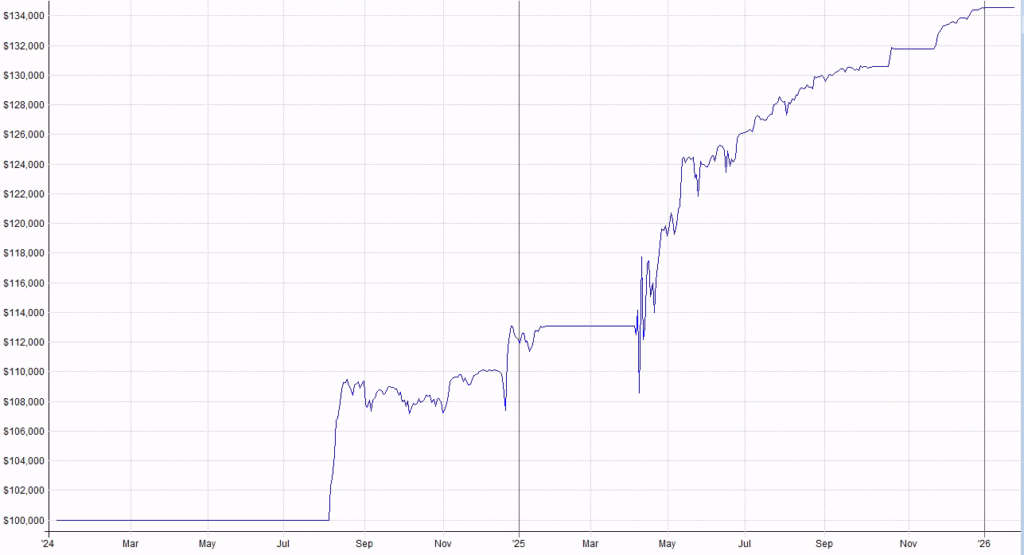
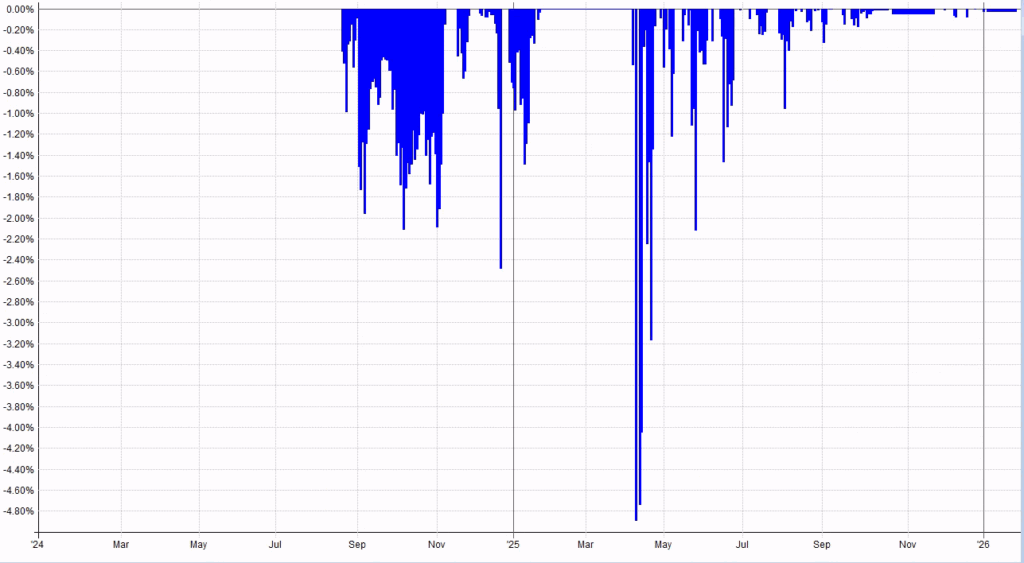
VX Long
ROR: 266.34%
MaxDD: -20.62%
PctWins: 91.67%
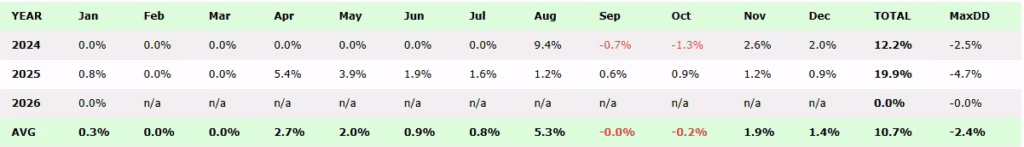
VX Short
ROR: 20.42%
MaxDD: -4.89%
PctWins: 98.12%
Performance charts
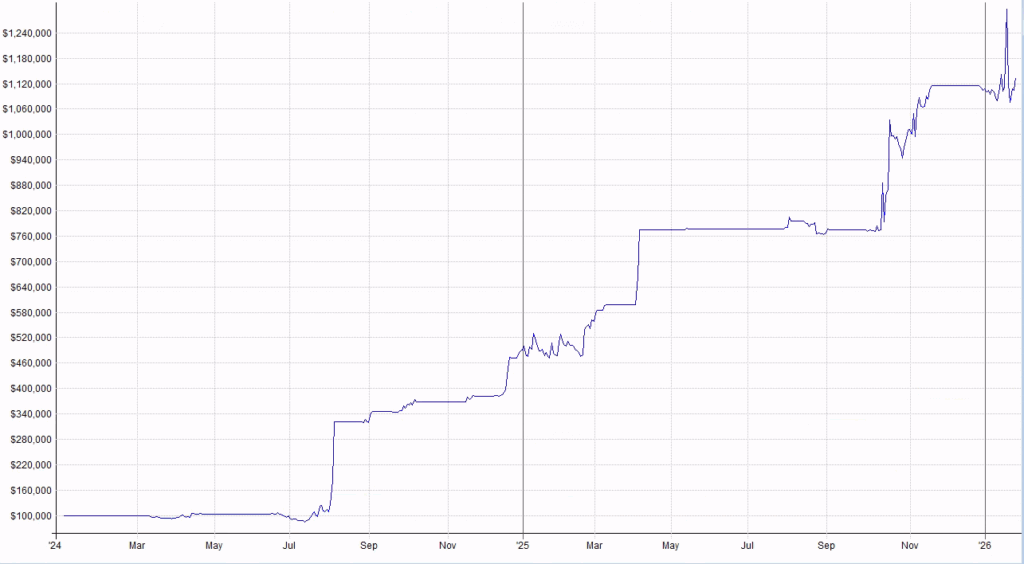
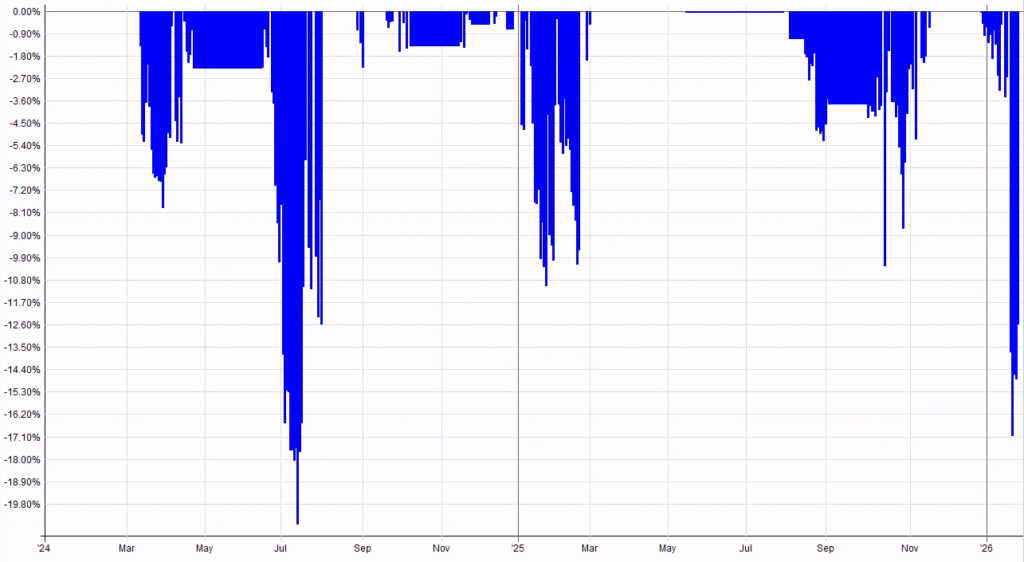
VX Long
Equity
Drawdown
VX Short
Equity
Drawdown
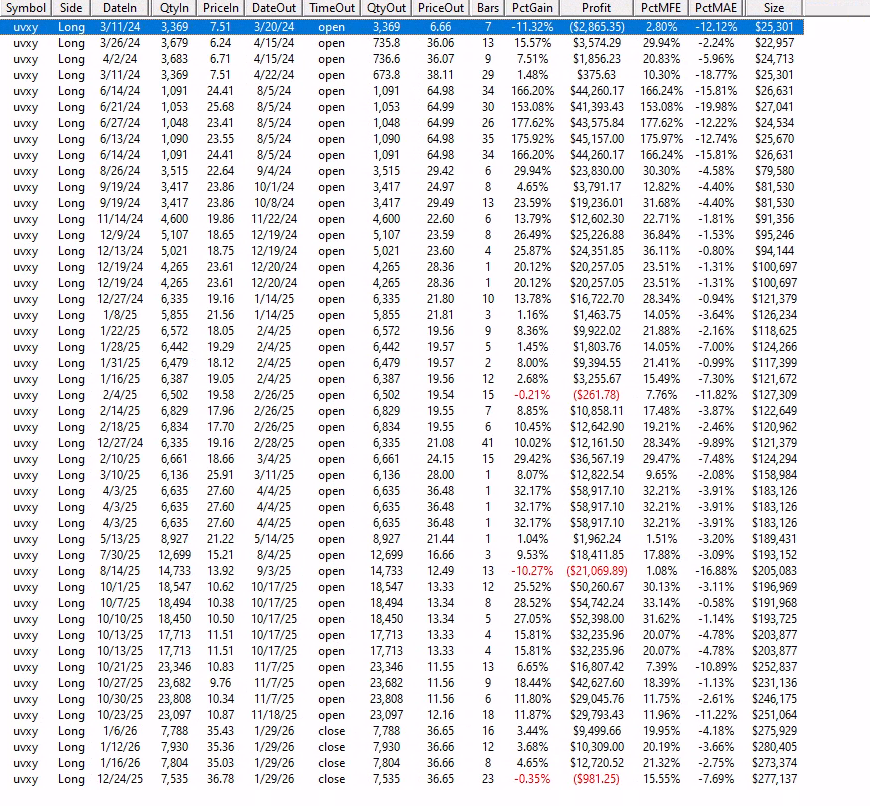
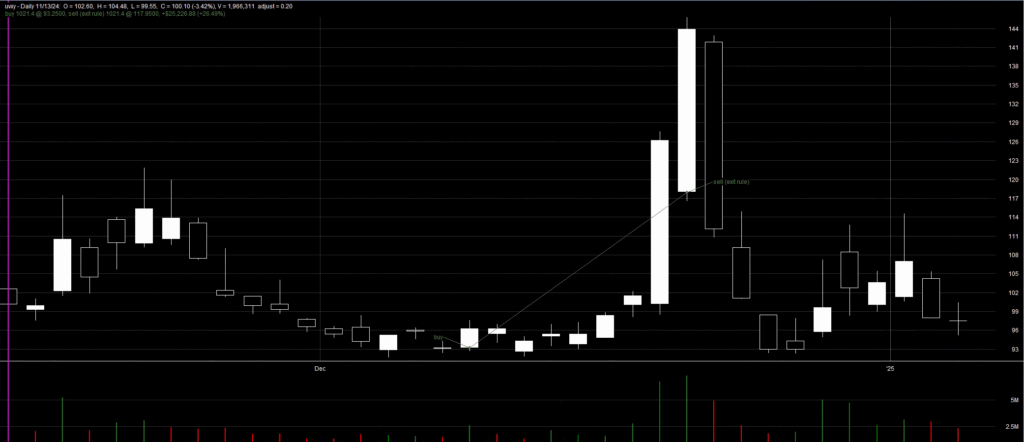
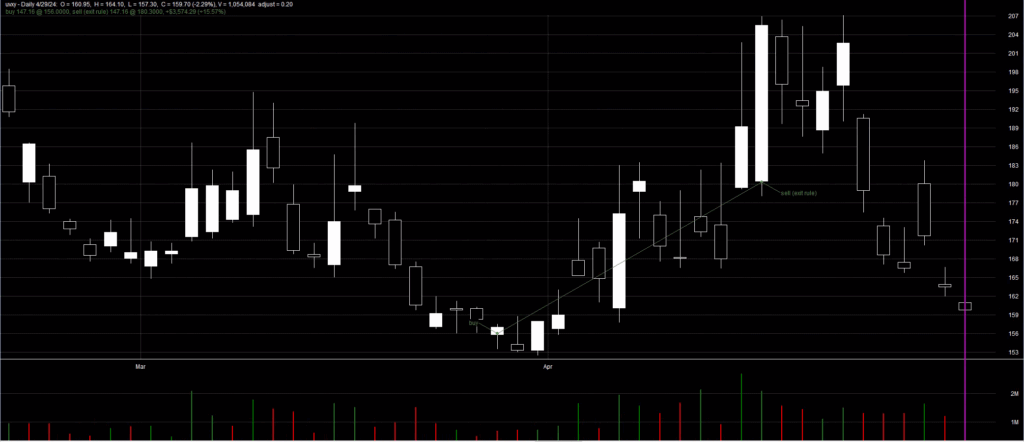
Sample Trades


Reviews
There are no reviews yet.